


The pioneer of dry dispersion
RODOS is the original by the inventor of dry dispersion. With this breakthrough innovation, Sympatec has opened up dry applications to particle measurement technology – as early as 1982. Since then, it has been possible to dry measure powders, fibres and granules appropriate to the product, with both laser diffraction and dynamic image analysis. No other method of dispersing is anywhere near as powerful or achieves such an efficient as well as gentle dispersion from the submicron to millimetre range.
Particle sizing with classic technologies


Manufacturing of lactose powders with defined physical properties
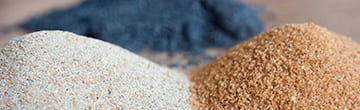
Lactose is a white, crystalline slightly sweet tasting powder. It is a disaccharide consisting of glucose and galactose and is widely used as an excipient in the pharmaceutical industry. Lactose powders are manufactured by selectively modifying the particle size, particle shape and particle size distribution of particles and they have special characteristics in terms of compactability, flow behaviour and granulability.
Coffee with a perfect grind
Inspired by capsule technology, the coffee industry is constantly bringing new types of coffee onto the market that continue to stimulate consumption. This increases the requirements for quality control, particularly with respect to the particle size distribution of coffee powder. Another challenge is the strong internationalisation of coffee producers, which makes comparability of analyses at different locations necessary. Industrial grinding of coffee and frequent changes in variety require a consistent, partially automated control of the particle size distribution to ensure consistent product quality.


